Share Market Update
The Australian share market has finished the September quarter up 0.21% (before dividends), or up 1.53% including dividends.
Most sectors performed flat or negatively over the quarter with the ASX Financials sector the worst performer down 2.43%. Energy and Resources fared better down 0.12% and 0.13% respectively for the September quarter.
Market volatility has increased due to the threat of trade wars and other potential destabilising factors occurring abroad. Good company earnings results have helped investment markets both here and overseas to navigate this volatility.
The US market is trading at all time highs, with the highest point on record being 26,743.50 on 21st September 2018. This compares to a Dow Jones index of 18,327.29 on 8th November 2016 when Trump was elected. Which is an increase of almost 46%.
Despite the Australian Share market ASX200 sitting at 10 year highs, our market is still to reach pre-GFC levels. The Australian Share market (ASX/200) reached a market high of 6,873.20 on 1st November 2007, followed by a low of 3,120 in March 2009. Our market closed at 6,207.56 on 28th September 2018.
By comparison, the US market peaked at 14,164.53 pre-GFC on 9th October 2007. The low point in the GFC occurred on 6th March 2009 when the Dow Jones dipped to 6,443.27. The Dow Jones closed at 26,443.15 on 28th September.
Accordingly, we have been increasing our cash holding of late.
Economic Update
As of September, the cash rate has been kept on hold at 1.50% for 25 consecutive months by the Reserve Bank of Australia (RBA).
In the September meeting minutes, the Board stated that the “…members continued to agree that the next move in the cash rate would more likely be an increase than a decrease…they also agreed there was no strong case for a near-term adjustment in monetary policy…” after all things considered.
The Board continue to see their stoic position with regard to monetary policy as “…a source of stability and confidence…” in achieving sustainable economic growth and the inflation target over time.
Australia’s economic growth remained strong in the June quarter, with GDP increasing 0.9% q/q in Q2, bringing annual growth (through-the-year) to 3.4% – the fastest rate of increase since the September quarter 2012. Growth was driven by solid pick-up in domestic demand with improving household consumption offsetting a decline in business investment. Net exports also made a positive contribution to growth in the quarter.
We expect momentum to remain positive in the near term, with exports boosted by new LNG capacity, renewed growth in public investment and an anticipated rebound in business investment. However, this will be undermined by softer consumer demand as employment growth slows, and by an expected decline in residential investment from the second half of this year. We see GDP growth remaining at 2.9% in FY19, before slowing to 2.6% in FY20.
Australian households have adapted to the stall in income growth by reducing their savings, allowing momentum in consumer spending to remain robust. As a result, the household saving ratio has fallen to its lowest level in 10 years. However, there isn’t much more room for the saving ratio to fall, which will put the brakes on further increases in consumer spending until the pace of household income growth accelerates.
Jobs growth bounced back in August, with a 44,000 increase in employment. Of this, 33,700 were full-time positions. The increase was matched by an increase in the labour force, with the participation rate increasing by 0.2%pts to 65.7%, which kept the unemployment rate steady at 5.3%.
Output growth is catching up with last year’s bumper increase in jobs, with the economy expanding at its fastest pace since 2012 in the June quarter. However, we expect the pace to moderate in the coming months as the residential downturn takes hold and momentum in consumer spending cools. This will put a dampener on the labour market, and we expect the patchy performance seen so far this year to continue into 2019.
Source: BIS Oxford, RBA, UBS
Property Market Update
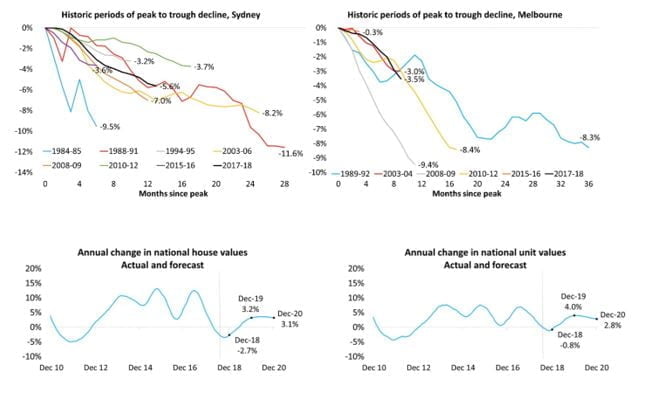
Source CoreLogic
Without a doubt, housing risks are heightened relative to a year ago. Dwelling values are slipping lower nationally (down 2% since peaking in September last year), mortgage rates are edging higher (up by around 15 basis points from three of the four major banks announcing a rate rise in September) and mortgage arrears have moved off their record lows (but still only around 0.6% of all mortgages are 90+ days in arrears). All this against a backdrop of record high levels of household debt (the ratio of disposable income to household debt reached 190% in March this year), increasing levels of housing supply and rising domestic and global uncertainty.
Australia’s largest housing market, Sydney, has seen values fall by 5.6% since peaking in July last year; a trajectory that is straight down the middle of previous downturns. During the GFC, Sydney dwelling values fell by 7.0% in the space of twelve months, and the downturn before that (2003-2006) saw values fall 7.1% over the same number of months.
Australia’s second largest city, Melbourne, has seen values falling since November last year. Since that time the market is down a cumulative 3.5% and the descent has generally been milder relative to previous downturns. Perth dwelling values peaked in 2014 and have fallen by 12.6% and in Darwin where conditions have been even tougher, dwelling values are down 21.8%.
Forecasting the movement in asset values is challenging at the best of times. With so much uncertainty at the moment it’s even harder. Several wildcards remain that could have a negative impact on the direction of housing values.
Households are more sensitive than ever to interest rate movements due to the record level of household debt. Roughly 70% of household debt is housing related, which implies small changes to mortgage rates could have an amplified impact on household balance sheets. Further out of cycle movements in mortgage interest rates could have a negative impact on the market. On the flipside, if the RBA decides to cut the cash rate further (a possible scenario of economic conditions weakened and housing price falls accelerated), this would likely see a rise in housing activity and help to place a floor under housing prices.
There is also the potential for changes to property taxation policies that could have a further dampening effect on investment demand. A Shorten Labor Government would reduce the capital gains tax discount from 50% to 25% and restrict negative gearing to new dwellings only.
Based on the value of new housing finance commitments, investors still comprise around 41% of mortgage demand, down from 55% in mid-2015. Investor concentrations remain well above their long term averages across New South Wales (49% of housing finance commitments) and Victoria (41% of housing finance commitments), implying Sydney and Melbourne would have more to lose if investor activity were to drop more substantially. Investors are already being disincentivised by falling prices, mortgage rate premiums and low rental yields; additional disincentives from tax reform could see demand reduce further, creating some slack in the overall demand composition for Australian housing.
In balance, even with mortgage rates edging higher, we are still in the lowest mortgage rate environment since the 1960’s. Population growth remains strong and maintaining a consistent migration policy seems to have support from both sides of politics which will continue to support demand for housing. Labour markets are reasonably healthy with unemployment holding at 5.3% and likely to trend lower, underemployment at the lowest rate since May 2014 and jobs growth above the long term trend.
Overall, it’s hard to see a scenario where Australian housing values could fall off a cliff. For this to happen we would need to see a material about face in labour market conditions, a global shock or a material rise in interest rates – none of which seems to be a likely outcome at the moment.