Markets
Local: The ASX200 index rose 2.4% in March. The Consumer Discretionary sector lead the way with a 7.0% rise, while the Materials sector was the worst performer, falling 3.0% over the period.
Global: The S&P500 index rose 4.4% in March.
Gold: Spot price for Gold fell to $1,691.05.
Iron Ore: Iron Ore fell to US $165 per ton.
Oil: Brent Oil slipped to US $63.54 per ton.
Property
Housing: CoreLogic dwelling prices boomed 2.6% in March, the strongest single month rise seen since 1988. Supply is very low, with new listings in March 25.5% below the 5-year average while demand is strong, seeing sales jump ~43% year-on-year. This interaction is now the driving force pushing prices up.
Building Approvals: Private sector housing approvals rose by 15.1% in February, reaching a new record high of 13,939 houses. Approvals for private sector dwellings increased 45.3% in February but remain 28.7% lower than February 2020.
Economy
Interest Rates: RBA Cash rate remained unchanged at 0.10%. More details can be found regarding the RBA Cash Rate in the Comments sections
Retail Sales: February retail sales fell 0.8%. While disappointing to some, it is a considerable improvement compared to the 4.1% fall in December.
Bond Yields: Australian government 10-year bond yield fell 10 points to 1.79%.
Exchange Rate: The Aussie dollar fell slightly to both the American dollar, at $0.760, and to the Euro at $0.649.
Consumer Confidence: Westpac’s Melbourne Institute recorded another lift in consumer sentiment, up 2.6% following the strong showing in February (1.9%).
Business Conditions: Meanwhile, NAB business conditions rebounded to +15.4 in February (previous: +9.1), and business confidence lifted to +16.4 (previous: +12.0).
Employment: Job Vacancies increased strongly in the Feb-21 quarter, bringing a year-on-year increase of 26.8%, the fastest rise in over a decade. Unemployment is currently sitting at 5.8% and is about to increase by up to 0.5% due to the cessation of the JobKeeper payment. These two factors should work to cancel each other out, with many people who lose employment post-JobKeeper being able to gain new employment quickly.
Purchasing Managers Index: Rather than measure an economy directly, a PMI measures the business activity that helps drive it. A PMI above 50 indicates an expanding market, while a PMI below 50 indicates a contraction. The Australian PMI has risen 1.87% to 59.9 while the US PMI has risen 6.41% to 64.7.
Covid: Infection levels are rising in 69 countries. 131 million infections have been recorded by the end of March, resulting in 2.9 million deaths. 152 countries have started vaccination campaigns, with 664 million doses being delivered so far.
Comment
Tis the Season
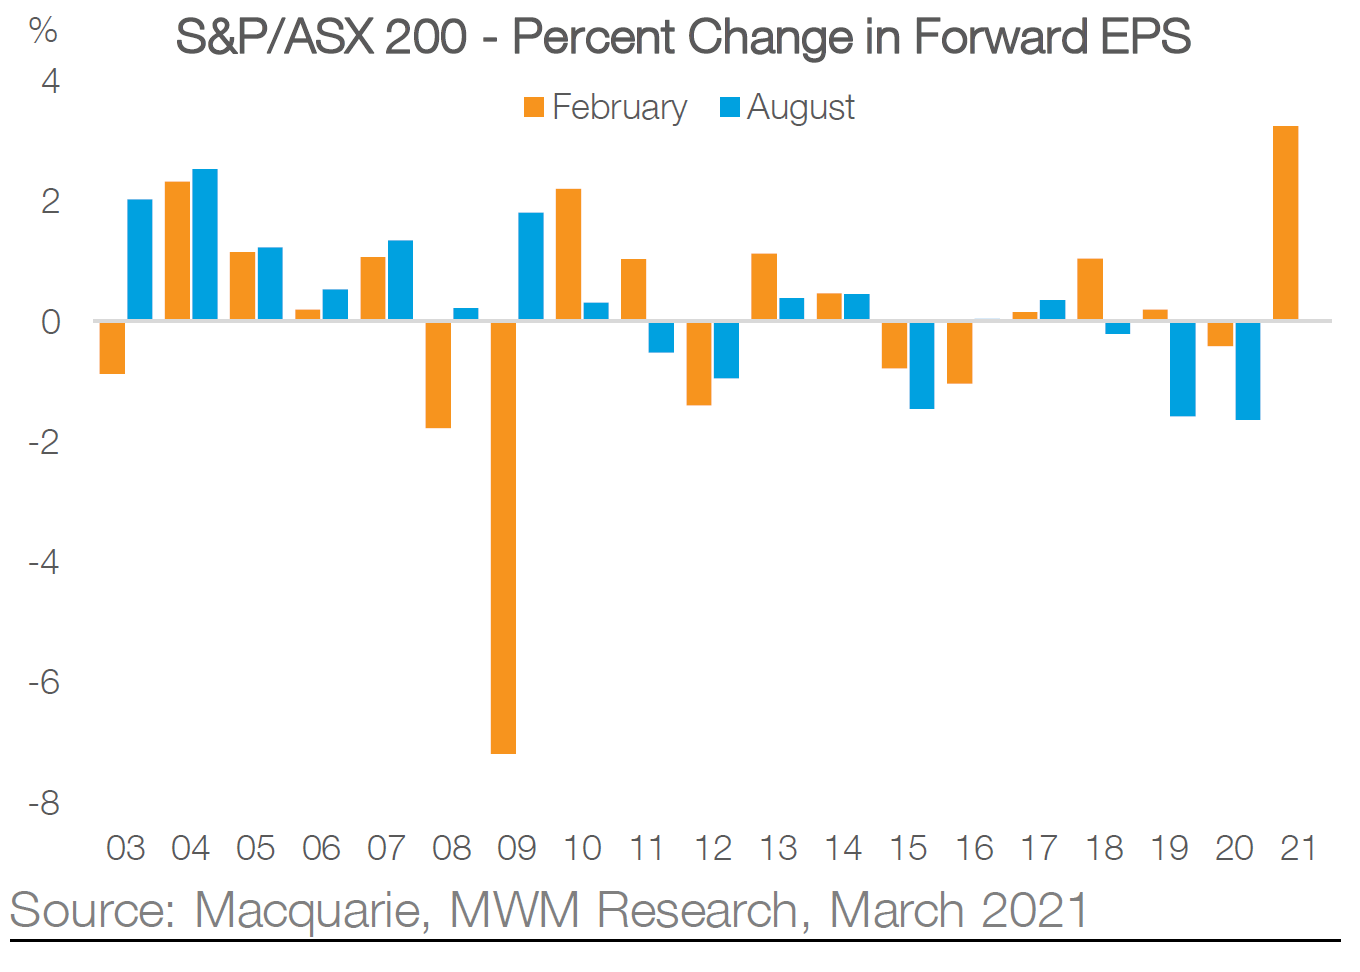
The business Reporting Season is complete, and it looks like there will be plenty to be jolly about in the coming years. Large, publicly listed companies release reports about their activities twice a year, once starting around February then again around August.
Earnings estimates were substantially lowered this season, with many organisations either directly affected by Covid or indirectly affected by the economic slump Covid brought with it. Despite the challenges of the moment, 51% of companies managed to beat their estimates, the highest percentage of positive surprises in over a decade.
The strongest performing sectors were Miners and the Banks, with the Macquarie Wealth Management team predicting that “together they will account for the majority of the forecast dividend recovery for the Australian market over the coming 2 years”.
While sectors directly impacted by the pandemic (Travel, energy etc) did not perform as strongly, the market is clearly optimistic about recovery. These factors combine to provide the highest Earnings per Share ratio seen in recent history, as shown in the graph below.
What is Needed for Interest Rates to Rise?
When you see the media discussing interest rates, they are usually talking about the Cash Rate Target. This rate is set by the Reserve Bank of Australia (RBA) during their monthly board meeting. It is the interest rate on overnight, unsecured loans between the banks. While this is not something that will ever affect you directly, all banks use this rate as the basis of determining their other rates. If the Cash Rate rises by 0.25% for example, your home loan is likely to see the same increases shortly afterwards.
What is the RBA trying to achieve by making these changes? In their own words, the RBA “Works to maintain a strong financial system” and manipulating the Cash Rate is one way to steer the national economy in their attempt to achieve that goal.
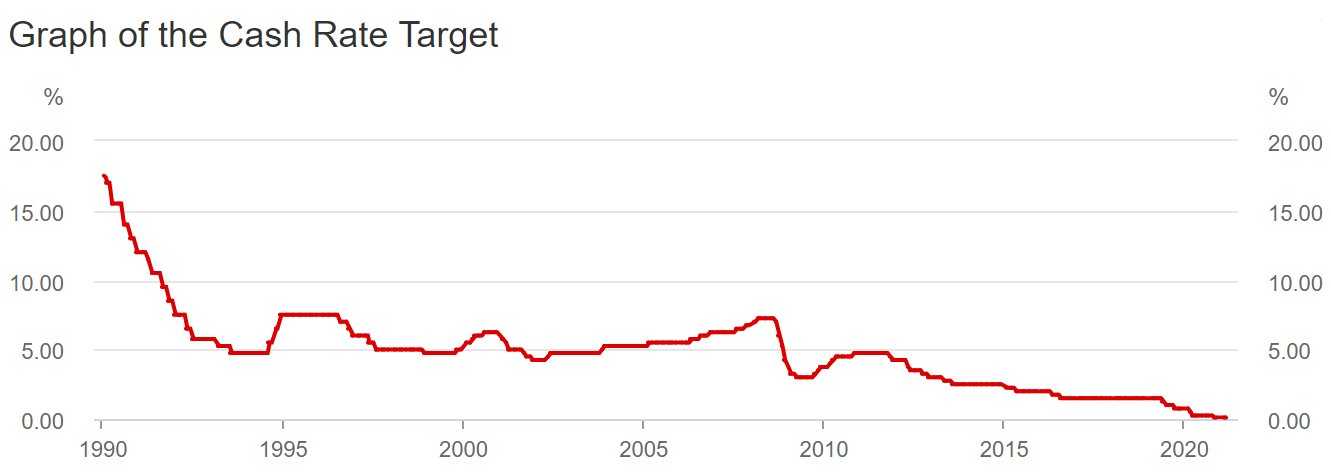
RBA deputy governor Guy Debelle has recently discussed the cash rate, currently sitting at a record low of 0.1%pa. He said he would like to see unemployment drop to “Low 4s” or “High 3s” before increasing interest rates. The Australian unemployment rate is currently 5.80% as Covid19 continues to disrupt the labour market.
Dr Debelle further explained that his real concern is Wage Growth, which is closely linked to the unemployment rate. Whenever unemployment is high, wage growth is usually low, as there is a lot of competition for any one role. Dr Debelle does not expect the labour market to be tight enough to increase Wage Growth thereby justifying tighter monetary policy until at least 2024. This is clearly a view that is shared by the Commonwealth Bank of Australia, who have further lowered their two-year fixed interest rates, but have increased their four-year rates.
Suez Concerns
While factors affecting the global economy are often intangible constructs like ‘confidence’, occasionally there is a factor that can be seen with the naked eye. In the case of the Ever Given, it could be seen from space. The Ever Given is a 224,000-ton container ship that got lodged in the Suez Canal for 6 days, 7 hours and was refloated and cleared from the passage 29th March.
While a single ship lodged in a single passage may seem insignificant, the impact on global trade is disproportionately large. Around 12% of all trade globally passes through the Suez Canal. Llyod’s List, a London base shipping journal estimates the value of delayed goods to be ~400 million US Dollars every hour the passage is disrupted.
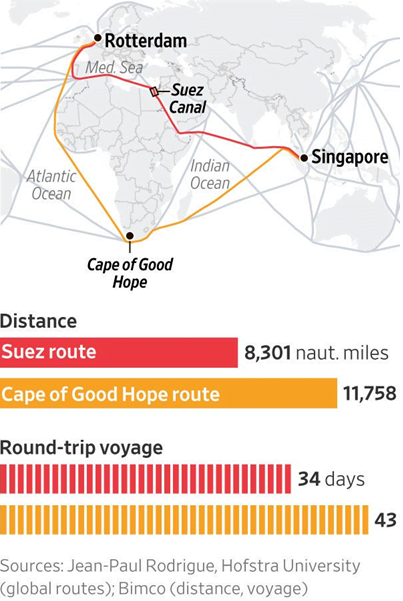
As the disruption lasted less than a week, the flow on effects of this event will be limited in most areas, though industries facing existing shortages, such as semiconductors and high-end processors, will be hit hard. We know that the blockage was cleared so quickly with the clarity of hindsight alone. Without this knowledge, many vessels have already been redirected around the Cape of Good Hope, adding significant additional costs and delays to the logistic chains of millions of products, while vessels that chose to wait will face significant delays while the backlog is cleared.
This event highlights both the importance of artificial nature of all international shipping lanes importance to global economic activity.