Markets
- Market Performance – ASX200 continued to climb adding 2.5% in June, and a total of 16.2% in the June quarter although the index fell 10.89% for the year.
- Sector Performance – IT (+5.96%) Consumer Discretionary (+5.37%) & Consumer Staples (+5.09%) sectors outperformed.
- Global – in the US the S&P500 index rose 1.8% in June after a 4.8% jump in May.
- Gold – continued its strong rise to another all time high of $1,781.89/oz, an increase of over $53.00 in the month of June. An increase of 3% for the month.
- Iron Ore – rose to $103.30/ton with strong demand continuing.
- Oil – rose to US$39.68/bbl as at the end of June.
Property
- Housing – dwelling prices dropped 0.7% in June nationally. Melbourne was down 1.1% while Sydney dropped 0.8% in the month.
- Sydney Dwelling Values – are however still down 3.5% below their record high in July 2017.
- Home Sales Volumes – have increased in May and June but are still 15.8% lower than the recent peak in March.
- Home Sale Trends – homes are taking longer to sell increasing from an average of 43 days in the March quarter to 45 days in the June quarter while vendor discounting increased from 4.3% to 4.4% over the same period.
- Residential Building Approvals – slumped 16.4% in May (month on month) the biggest monthly decline since 2017 to 153,000 dwellings, an 8 year low.
Economy
- Interest Rates – were left on hold at 0.25%.
- Bond Yield – Australian 10-year Government bond yields were steady at 0.90% while US Government 10-year bond yields rose only 2 bps to 0.66%.
- Consumer Confidence – the ANZ Roy Morgan consumer confidence survey fell to 93.0 in late June 2020 compared to the recent peak of 109.1 in February 2020. That represents a 15% fall.
- Exchange Rates – the Australian Dollar rose against the US Dollar to 0.693 (from 0.664 in May).
- Unemployment – rose to 7.1%.
- Chicago Purchasing Managers Index (PMI) – having fallen for the 11th straight month to 32.3 in May, the index jumped to 36.6 in June. While a welcomed increase it is still well short of the 50 plus index reading required to indicate a growing economy.
- US Jobs – surprisingly 4.8 million jobs were added in the month of June and the unemployment rate fell to 11.1%.
- German Factory Orders – rose 10.4% have fallen by approximately 37% in the months of March and April.
- French Consumption – of household goods jumped 36.6% in June. While this represents a strong recovery household consumption is still 7.2% below its February level.
Sources: UBS, Westpac, S&P Dow Jones Indices, ABS, US BLS, CoreLogic, Morningstar
Comment – Innovation
Example 1
Apple generated 61% of its revenue from iphones in the first quarter of 2020.
However last year it sold 2 million units only in India where Samsung sold 30 million units and Xiaomi sold 44 million units with its cheap price point mobile phone.
Apple has traditionally taken a premium price position in the market and has accordingly struggled for market share.
Identifying the problem Apple recently launched the iphone SE budget phone that retails for about $400.00. Apple hope to gain market share in India as a result and magnify its global dominance of the iphone market.
The moral to this story is – even companies that dominate the global stage continually innovate to compete, grow and prosper. It’s the companies that don’t that disappear.
Example 2
Afterpay is a relative new business which allows you to pay for simple retail purchases in 3 monthly instalments. Whether you are buying a new TV or a new shirt lots of people are turning to Afterpay to spread the cost of the purchase out over time. It’s only if you are late with a payment that you are charged with a fee.
Interestingly, Afterpay claims it is not providing a credit service and for the time being avoids being regulated by the tsunami of regulations that surrounds the provision of credit services.
Anyway on July 1, 2020, an analyst from Citi upgraded the price target for Afterpay from $27 to $64 despite the fact the company does not yet make a profit.
Forward estimates indicate the company may become profitable in 2022.
If it achieves those forecasts (which is optimistic) it means the company is currently trading on a Price Earnings (PE) multiple of 283 times where the ASX market average is about 20.
This type of valuation challenges the traditionally orthodox view that value is a function of profitability.
How much profit this company can make in the future will be based on 2 key factors:
a) fees for late payment; and
b) income from the sale of customer spending habits to data retailers and advertisers.
It is this second income stream that is the big unknown and why people say we live now in a world of BIG DATA.
Example 3
Tesla is currently valued at $224 billion US dollars. By way of comparison other vehicle manufacturing companies are valued as follows:
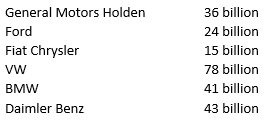
So once again you can see that valuations can differ widely. Knowing which companies are profitable now or likely to be profitable in the future is important. The investor needs to understand whether he is buying a promise or hope in a future technology race or is he/she buying a known profitable and experienced team who continually deliver in good times and bad.
Often the choice is:
“Do you want an investment, or do you want a punt (or gamble)?”
Obviously, the choice is more complex than this but often the high flyer’s are also high risk.