Markets
Local: The ASX 200 rose steadily at 1.09% over July, a tenth straight monthly gain.
Global: The S&P500 index rose 2.3% in July.
Gold: Spot price for Gold increased slightly from the previous month to $1813.58.
Iron Ore: Iron Ore has continued its recent price surge to US $215.50 per ton.
Oil: Brent Oil continued its strong rise this year, closing at US $73.95 per ton.
Property
Housing: Australian housing values increased a further 1.6% in July, according to CoreLogic’s national home value index. The latest rise takes housing values 14.1% higher over the first seven months of the year and 16.1% higher over the past twelve months. The fastest pace of annual growth since February 2004. On the flip side, demand is being stocked by record low mortgage rates and the prospect that interest rates will remain low for an extended period of time. Dwelling sales are tracking approximately 40% above the five-year average while active listings remain about -26% below the five-year average. The mismatch between demand and advertised supply remains a key factor placing upwards pressure on housing prices.
The pace of dwelling price appreciation has slowed across each of the capital cities. Sydney has recorded the sharpest reduction, with the monthly capital gain falling from 3.7% in March to 2.0% in July. However, the annual growth rate in Sydney was still high at 18.2%.
Economy
Interest Rates: RBA Cash rate remained unchanged at 0.10%.
Bond Yields: Australian government 10-year bonds slipped to 1.19%.
Exchange Rate: The Aussie dollar depreciated again this month against both the American dollar, at $0.735, and the Euro at $0.621.
Job Ads: Despite lockdowns, ANZ job ads remain resilient in July, down by only 0.5% from the month prior and still up a very strong 94.1% over the past 12 months.
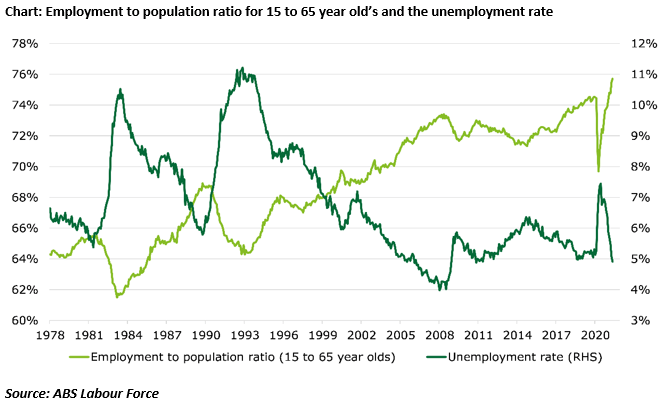
Employment: The unemployment rate stayed low at 5.1% with employment growth at 8.1%. However, with the most recent lockdowns employment could fall by 200,000 and unemployment may increase by 50,000.
UK Employment: The UK also continued its economic recovery with a further reduction in the unemployment rate to 4.8%, with restrictions easing there were 862,000 job vacancies in April-June 2021, 77,500 above pre-pandemic levels.
Consumer Confidence: The Westpac-Melbourne Institute Index of Consumer Sentiment rose by 1.5% to 108.8 in July from 107.2 in June. The modest sentiment increase in July follows a 9.8% fall in the index over the previous 2 months. The sharp rise in COVID cases and associated move to lockdown in Sydney hit NSW consumer confidence hard, the state index dropping 10.2%, including a 13.6% fall in Sydney. However, this was fully offset by strong recoveries in Victoria (up 10.5%) and Western Australia (up 15%) as both states came out of lockdown. The current fall in Sydney compares with a 7.3% fall in Sydney during the Northern Beaches lockdown at the start of the year and the 18.7% fall in Melbourne heading into the ‘second wave’ lockdown in June-August last year.
GDP: A contraction of 2.2% in Q3 is now expected because of the NSW lockdowns. Activity in NSW fell 7.8%.
Purchasing Managers Index: Rather than measure an economy directly, a PMI measures the business activity that helps drive it. A PMI above 50 indicates an expanding market, while a PMI below 50 indicates a contraction. Australia stayed in strong expansionary territory at 60.8 points in July but eased by 2.4 points from the record high in June (seasonally adjusted). This indicated strong (but decelerating) growth for manufacturing activity in June, despite widespread lockdowns. This was the tenth consecutive month of recovery for the Australian PMI following the severe disruptions of COVID-19 in 2020.
Covid: At the end of July 2021 a total of 33,732 cases of COVID-19 have been reported in Australia, 922 deaths and approximately 2,857 active cases. To date, more than 24,697,500 tests have been conducted nationally. Of those tests conducted, 0.1% have been positive. Currently in Australia, 41% have received one dose and 19% have received both doses. This is in stark contrast to other developed economies such as the UK which currently has 90% of the adult population having a least one dose and over 70% of the adult population have had both doses.
Comment
Delta a strain on our stunning jobs recovery
Recent labour force data from the Australian Bureau of statistics may have been cause for country wide celebration, the national unemployment rate declined to 4.9% in June, levels not seen for close to a decade.
This positive news however was overwhelmed by the news Victoria would be heading into another lockdown, followed by significant extensions to restrictions in Greater Sydney. These particular lockdowns driven by the emergent COVID Delta strain will have notable short term impacts on the Australian economy which will of course be financially and socially devastating for both individuals and small businesses.
For the broader economy however, the starting point was positive. During June, employment numbers increased by 29,100 nationally. Queensland (+16,500) and WA (+12,500) more than offsetting the decline in NSW (-9,000) and Victoria (-9,000).
However, not all the news was positive, and a potential precursor for where we may be heading.
The June Labour Force Survey reference period was Sunday 30 May to Saturday 12 June, which included Victoria’s 14-day lockdown beginning 28 May. The impact of the Victorian lockdown on the national numbers can be seen in a decline in total hours worked, and an increase in the underemployment rate. Total hours worked declined 1.8% nationally, with total hours worked falling by 8.4% in Victoria.
The unemployment rate declined in Victoria to a stunning low of 4.4%, but the participation rate also declined, with some people leaving the labour force. The decline in total hours worked saw the underemployment rate increase nationally to 7.9%, with the underemployment rate in Victoria jumping more than two percentage points to 10%.
This June data, and the current situation, suggests that the Australian labour markets incredible recovery is coming to an impending halt. To date, we have seen relatively quick recoveries from short lockdowns, but governments are now looking at lengthier lockdowns covering larger sections of the population. Consumer confidence has started slumping again in NSW and on average around 25,000 jobs may be lost every week Sydney is in lockdown. The speed of the job recovery effort once restrictions are eased is not clear due to the Delta strain creating much more uncertainty about NSW’s pathway out of restrictions and may stay this way until vaccination rates have become adequate.
Despite this being said, from a broader economic perspective, the labour force data showed us we were heading into these broader lockdowns with a high degree of economic momentum, a far cry from the rut we seemed to have been in over 12 months ago when initial lockdowns were in place.
Brisbane Olympic Games 2032 – Worth its weight in gold?
The International Olympic Committee`s illustrious business model means host cities are invariably losing out. Brisbane may need a colossal effort to avoid the same fate as its predecessors.
This effective private monopoly has over the past 125 years or so convinced 62 cities, and often their national governments, to flash up ever increasing amounts of cash to have the privilege of hosting this sporting tourist attraction for a couple of weeks. The Olympics have rarely been beneficial to the host with most games running at a loss inspired by massive cost overruns. Why would Brisbane be any different?
The Tokyo 2020 Olympics originally budgeted $US7.4 billion, but Japanese government auditors have stated total spending toped $US20 billion ($AU27 billion), an almost 200 per cent budget blow out.
Since 1976, the average budget overrun on Summer Olympics is 213 per cent with the median at 120 per cent. The Montreal Olympics in 1976 is leading the pack for having the worst result, with a whopping 720 per cent increase over their initial budget, resulting in a debt that took nearly 30 years to repay. Rio 2016 was second with a 352 per cent increase over budget.
Studies suggest that there are unquantifiable and unpredictable risks with any Olympics. One of the most significant is the IOC`s interests being vastly misaligned with that of the host city. The IOC gains income from sponsorship and broadcasting rights, clips the tickets for 10 per cent and distributes the remaining 90 per cent to the host city (which gets 50 per cent), and the remaining distributed to local Olympic committees and promotional projects. The 10 per cent is generous to say the least, with the IOC’s 500 staff, representing 96 per cent of administrative costs, being paid an average of $274,228 a year in 2019.
Its income depends on as large and grand an event as possible, so as to stimulate the appetites of broadcasters and sponsors alike and is directly proportional in size to this appetite. This leads to pressure on the host to improve and expand on what is delivered.
Back home the budget for the Brisbane 2032 Olympics is set at $5billion. In contrast making it the cheapest since the Athens Olympics, even cheaper than the 2000 Sydney Olympics, which does sound ambitious to say the least. According to the Flyyberg study from Oxford University, the amount has at least a 20 per cent risk of being $15 billion or higher, which if did occur is 300 per cent above budget and sitting close to a blow out like Rio. However, Brisbane unlike many previous host cities is in a much better position. Three years ago, it staged the Commonwealth Games, modelling done by Griffith University show the games cost $1.6 billion or a mere 26 per cent over budget in comparison.
So, what is the actual upside of hosting if there is any?
The Commonwealth Games has to be the best gauge for Queensland’s likely Olympics performance, and the Griffith University study claims a modelled increase of 1.266 million visitors. The real measure of this should be overseas travellers, otherwise it is just an exercise in stealing domestic tourists from other states.
The real pitch for the Olympics claim is that 5000 jobs a year will be created until the commencement, with a further 130,000 in the Olympic year. If you want to compare this on the basis of job generation then it can be easily compared to a large scale project such as the Adani mine, which will employ 2000 people a year for up for 60 years. So, this mine will generate employment similar to levels seen in the Olympic year. That’s just one, there are nine proposed for the Galilee Basin. Furthermore, they will also pay hundreds of millions each year in royalties, on top of GST, stamp duty, payroll tax, the list goes on. Plus, the flow-on employment in service industries such as education, retail and health. All of this without the government needing to risk a single dollar. Putting your environmental hesitations from the mines aside the economic benefits of an Olympic hosting can be hard to justify.
Sources: ABS, AFR, ANZ, NAB Group Economics, Deloitte Access Economics, Macquarie MWM Research, RBA, UBS, Westpac, Trading Economics.