Markets
- Market Performance – ASX200 continued to climb adding 2.8% in August.
- Sector Performance – IT was up 15.5% while consumer discretionary spending was up 8.7%.
- Global – in the US the S&P500 index rose 7.7% in August after a 5.6% jump in July.
- Gold – dropped from $1,964.90/oz, to $1,957.35/oz $196 in the month of July.
- Iron Ore – rose strongly to $125.00/ton from $109.50/ton in July.
- Oil – rose to US$45.28/bbl as at the end of August up US$1.98/bbl.
Property
- Housing – dwelling prices dropped 0.4% in August nationally. Sydney was down 0.5% while Melbourne was down 1.1% in August.
- Values – home values fell for the 4th consecutive month in August by 0.4% nationally. Sydney was down 0.5% for August while Melbourne dropped 1.2% for the month.
- Auction Clearance Rates – in Sydney August saw clearance rates of 69.6% from 565 auctions while Melbourne saw a 30% clearance rate from only 30 auctions.
- Dwelling Approvals – declined a further 4.9% over June to 12,213; the lowest volume of approvals since July 2012.
- Finance – total credit in July fell 0.1% dragging the yearly decline to 2.4%.
Economy
- Interest Rates – were left on hold at 0.25%.
- Retail Sales – jumped in June by 2.7%m/m and a further 3.3% in July.
- Bond Yield – Global bond yields rose sharply in August with US 10 year government bonds rising 17 basis points to 0.70% while Australian government bonds rose to 0.98% from 0.82% in July.
- Consumer Confidence – the August Westpac Melbourne Institution consumer sentiment fell 9.5% (it was down 6.1% in July).
- Exchange Rates – the Australian Dollar rose again against the US Dollar to 0.74 (from 0.693 in May) a rise of over 4 cents.
- Unemployment – rose from 7.4% to 7.5% in July, a 22 year high.
- Chicago Purchasing Managers Index (PMI) – having fallen for 11 straight months to 32.3 in May and jumped to 36.6 in June, the Chicago PMI jumped strongly to 51.9 in July well above the 50 level indicating a growing economy. Despite the obvious problems of COVID, BLM and the upcoming November 3 election the index feel back to 51.2 in August. If this index stays above 50 it reflects a growing US economy despite all the problems.
- Chinese Economy – Chinese economic data strengthens with their July trade surplus totalling $62.3 billion which was well ahead of expectations of $42 billion.
- COVID 19 – on August 31 India broke USA’S record of highest COVID 19 cases in a single day registering 80,000 new cases in 24 hours.
Sources: UBS, Westpac, S&P Dow Jones Indices, ABS, US BLS, CoreLogic, Morningstar
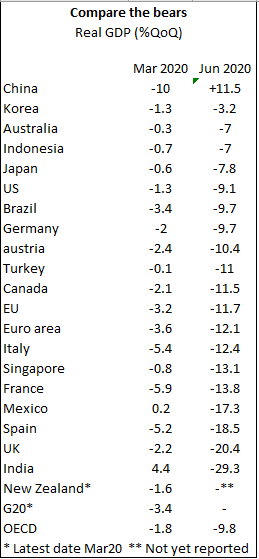
Comment
COVID 19 has hit economies around the globe. The table shows that while Australia experienced a 7% decline in GDP in the June quarter; that when you compare that to other countries we have performed better than most according to Treasury statistics.
Treasury says our unemployment rate will rise from the current 7.5% to over 9% by Christmas. Many forecasters estimate the unemployment rate will exceed 10%.
To put that into perspective that means around 1.2 million people will be wanting to work but do not have a job.
If you go back 6 months Australia’s unemployment rate was about 5%.
So in effect an additional 500,000 to 600,000 people will lose their job as a result of COVID 19 and that is if the forecasts are accurate.
After 28 years of economic growth a lot of people are about to learn what a recession really is.
To date JobKeeper has insulated many, but from October as the stimulus is wound back from the Federal Government, economic reality will kick in for a lot more Australian’s.